Day 3 — K-Nearest Neighbors and Bias–Variance Tradeoff


Today we’ll learn our first classification model, KNN, and discuss the concept of bias-variance tradeoff and cross-validation. Also, we could choose K based on cross-validation.
K-Nearest Neighbors (KNN)
The k-nearest neighbors algorithm (k-NN) is a non-parametric, lazy learning method used for classification and regression. The output based on the majority vote (for classification) or mean (or median, for regression) of the k-nearest neighbors in the feature space.
KNN is one of the simplest model since it is non-parametric and lazy learning method. What does it mean? When we say the model is non-parametric, it means that it does not make any assumption of the data distribution. It’s pretty useful in real world application, since most of the data may not follow any distribution. What about lazy learning? Opposed to eager learning, lazy learning is a learning method in which generalization of the training data is delayed until a query is made to the system. In other words, there is no explicit training stage, or it is very minimal, which also means that training is very fast in KNN.
The intuition of KNN is pretty simple. There is an old saying, one takes the behavior of one’s company. Imagine a group of educated, young, and smart people. It’s not hard to imagine that their friend is also the same style, educated, young, and smart.

There are only 3 steps for KNN:

Pretty easy, right? Now the problem is, what is K? How do we choose K?

Bias–Variance Tradeoff
Before we choose K, I want to explain an important concept in machine learning, bias-variance tradeoff. First of all, what is bias? And what is variance?
The bias is an error from erroneous assumptions in the learning algorithm. High bias can cause an algorithm to miss the relevant relations between features and target outputs. In other words, model with high bias pays very little attention to the training data and oversimplifies the model.
The variance is an error from sensitivity to small fluctuations in the training set. High variance can cause an algorithm to model the random noise in the training data, rather than the intended outputs. In other words, model with high variance pays a lot of attention to training data and does not generalize on the data which it hasn’t seen before.
More specifically, we use mathematical terms to define bias and variance. Again, if you are not comfortable with math, you can skip this. I’ll explain by graph in the next paragraph.


Bias is the difference between the true label and our prediction, and variance is defined in Statistics, the expectation of the squared deviation of a random variable from its mean. Here, f represents the model in true world. There exists random noise that we could not avoid, which we represent ϵ. The true label is represented by

And we can compute the error.

Let’s use a graph to explain. Imagine that the center of the target (red part) is the correct values of the data. As we move away from that region, the error becomes larger and larger. In this case, we get higher bias. Now imagine we get a number of separate predictions, which may be based on the variability in the training data. In this case, we get a higher variance.

There are other two terms related to bias and variance, underfitting and overfitting. Underfitting means the model does not fit, in other words, does not predict, the (training) data very well. On the other hand, overfitting means that the model predict the (training) data too well. It is too good to be true. If the new data point comes in, the prediction may be wrong. Normally, underfitting implies high bias and low variance, and overfitting implies low bias but high variance.
Dealing with bias-variance problem is about dealing with over- and under-fitting. Bias is reduced and variance is increased in relation to model complexity. Why? If the model is more complex, it means it has more power to capture the distribution of the data, which fits in the training set perfectly, in other word, overfitting.


Now we have another problem. How do we know if we are under- or over-fitting? In real world application, we would not know the ground truth of the test set. How do we compute the error if we don’t know the answer?
Cross-validation
The answer is pretty simple, just split the training set. Say we want to split the training set to A (80% of data) and B (20% of data). We then train our model based on A and test the model on B, since we know the ground truth of B now. B is called the validation set. We could use the validation set to tune our parameters, such as K in KNN. Remember that we could not use the ground truth of the validation set when we are training. We could use a more stable method called cross-validation to test the result. We rotate our validation set and use the rest of the data to train, say, split the data into K fold, and train on (K–1) folds and test on 1 fold as validation set, which is called K-fold cross validation. After that, we average all the errors to get the final accuracy.
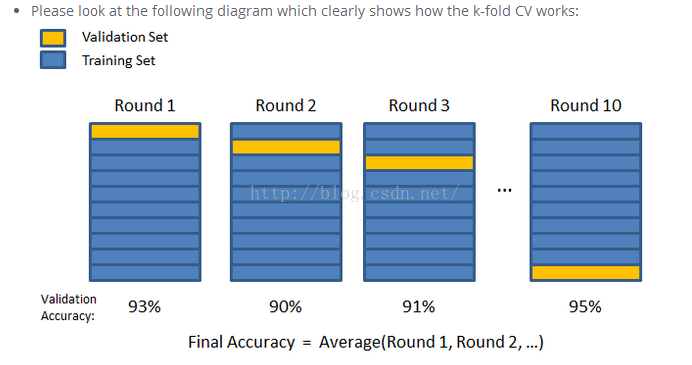
When K equals to the number of training set, it’s called Leave-one-out CV, since we only test on one sample each time and use the rest of the data to train.
Back to KNN
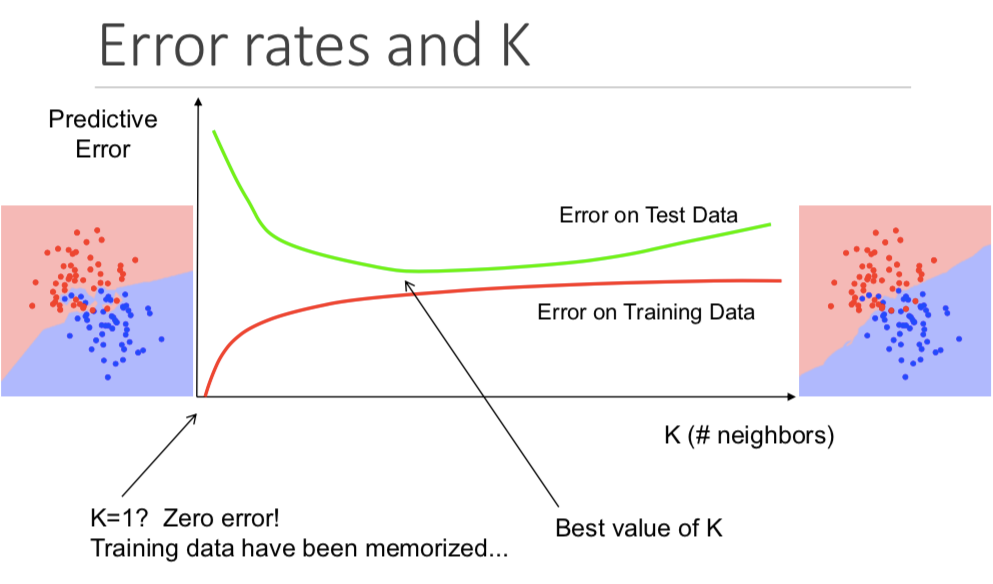
Let’s go back to KNN, how do the bias and variance relate to KNN? I just say that KNN is lazy learning at the beginning, how does it relate to model complexity? Now, consider an extreme case, K=1, what will it happen? The training data will be perfectly predicted, right? The bias will be 0 when K=1, however, when it comes to new data (in test set), it has higher chance to be an error, which causes high variance. When we increase K, the training error will increase (increase bias), but the test error may decrease at the same time (decrease variance). We can think that when K becomes larger, since it has to consider more neighbors, its model is more complex. Now we can split the data into training and validation set and decide what K should be like.
Programming it
We use Iris dataset to train our model. It has 3 classes which represent 3 different kinds of iris. Our goal is to classify which iris it is.
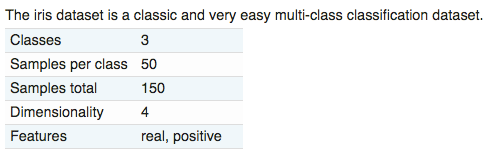
There are 4 features in this dataset. We do a little bit data exploration. It seems that we can separate the class by only 2 features. However, since we want to see how K affects the result, we choose feature 1 and 2 because it has more overlap.

We can build our model now! Remember, KNN does not have training step, so we predict the data directly. There are 3 steps for KNN, calculate the distance, find K nearest neighbors, and count the number of each label.
We test different K and visualize the decision boundary.

We can see that when K is small, there are some outliers of green label are still green, and outliers of red label are still red. When K becomes larger, the boundary is more consistent and reasonable.
Second, we use sklearn built-in KNN model and test the cross-validation accuracy. There is only one line to build the model.
And one line for cross-validation test.
The result shows that we could choose K around 13 or 20, which we’ll get the highest cross-validation accuracy.

You can find the whole implementation through this link. Feel free to play around with it!
Summary
Today we learn about KNN model, which has 3 steps,
And few pros and cons about KNN.
Congratulations! We learn our first model for classification. I hope this article helps a little in understanding what the K-Nearest Neighbor algorithm is and how we could choose K based on the cross-validation accuracy. As always, I welcome questions, notes, suggestions etc. Enjoy the journey and keep learning!
Understanding the Bias-Variance Tradeoff

May 21, 2018 · 4 min read
Whenever we discuss model prediction, it’s important to understand prediction errors (bias and variance). There is a tradeoff between a model’s ability to minimize bias and variance. Gaining a proper understanding of these errors would help us not only to build accurate models but also to avoid the mistake of overfitting and underfitting.
So let’s start with the basics and see how they make difference to our machine learning Models.
Bias is the difference betw e en the average prediction of our model and the correct value which we are trying to predict. Model with high bias pays very little attention to the training data and oversimplifies the model. It always leads to high error on training and test data.
Variance is the variability of model prediction for a given data point or a value which tells us spread of our data. Model with high variance pays a lot of attention to training data and does not generalize on the data which it hasn’t seen before. As a result, such models perform very well on training data but has high error rates on test data.
Let the variable we are trying to predict as Y and other covariates as X. We assume there is a relationship between the two such that
Where e is the error term and it’s normally distributed with a mean of 0.
We will make a model f^(X) of f(X) using linear regression or any other modeling technique.
So the expected squared error at a point x is

The Err(x) can be further decomposed as

Err(x) is the sum of Bias², variance and the irreducible error.
Irreducible error is the error that can’t be reduced by creating good models. It is a measure of the amount of noise in our data. Here it is important to understand that no matter how good we make our model, our data will have certain amount of noise or irreducible error that can not be removed.
Bias and variance using bulls-eye diagram

In the above diagram, center of the target is a model that perfectly predicts correct values. As we move away from the bulls-eye our predictions become get worse and worse. We can repeat our process of model building to get separate hits on the target.
In supervised learning, underfitting happens when a model unable to capture the underlying pattern of the data. These models usually have high bias and low variance. It happens when we have very less amount of data to build an accurate model or when we try to build a linear model with a nonlinear data. Also, these kind of models are very simple to capture the complex patterns in data like Linear and logistic regression.
In supervised learning, overfitting happens when our model captures the noise along with the underlying pattern in data. It happens when we train our model a lot over noisy dataset. These models have low bias and high variance. These models are very complex like Decision trees which are prone to overfitting.

Why is Bias Variance Tradeoff?
If our model is too simple and has very few parameters then it may have high bias and low variance. On the other hand if our model has large number of parameters then it’s going to have high variance and low bias. So we need to find the right/good balance without overfitting and underfitting the data.
This tradeoff in complexity is why there is a tradeoff between bias and variance. An algorithm can’t be more complex and less complex at the same time.
To build a good model, we need to find a good balance between bias and variance such that it minimizes the total error.


An optimal balance of bias and variance would never overfit or underfit the model.
Therefore understanding bias and variance is critical for understanding the behavior of prediction models.
Понимание компромисса смещения
Дата публикации May 21, 2018
Всякий раз, когда мы обсуждаем прогнозирование модели, важно понимать ошибки прогнозирования (смещение и дисперсия). Существует компромисс между способностью модели минимизировать смещение и дисперсию. Получение правильного понимания этих ошибок поможет нам не только построить точные модели, но и избежать ошибки переоснащения и недостаточной подгонки.
Итак, давайте начнем с основ и посмотрим, как они влияют на наши модели машинного обучения.
Что такое уклон?
Что такое дисперсия?
Математически
Пусть переменная, которую мы пытаемся предсказать как Y, а другие ковариаты как X. Мы предполагаем, что между ними существует такая связь, что
Мы сделаем модель f ^ (X) для f (X), используя линейную регрессию или любую другую технику моделирования.
Таким образом, ожидаемая квадратная ошибка в точке х

Err (x) может быть далее разложен как

Смещение и дисперсия, используя диаграмму «бычий глаз»

В контролируемом обучении,underfittingпроисходит, когда модель не может захватить базовый шаблон данных. Эти модели обычно имеют высокий уклон и низкую дисперсию. Это происходит, когда у нас очень мало данных для построения точной модели или когда мы пытаемся построить линейную модель с нелинейными данными. Кроме того, такого рода модели очень просты для захвата сложных моделей в данных, таких как линейная и логистическая регрессия.
В контролируемом обучении,переобученияпроисходит, когда наша модель фиксирует шум вместе с базовым шаблоном в данных. Это происходит, когда мы много тренируемся в нашей модели из-за шумного набора данных. Эти модели имеют низкий уклон и высокую дисперсию. Эти модели очень сложны, как деревья решений, которые склонны к переоснащению.

Почему Bias Variance Tradeoff?
Если наша модель слишком проста и имеет очень мало параметров, то она может иметь высокое смещение и низкую дисперсию. С другой стороны, если наша модель имеет большое количество параметров, она будет иметь высокую дисперсию и низкое смещение. Таким образом, мы должны найти правильный / хороший баланс, не перегружая и не подбирая данные.
Этот компромисс между сложностью и является причиной компромисса между смещением и дисперсией. Алгоритм не может быть более сложным и менее сложным одновременно.
Общая ошибка
Чтобы построить хорошую модель, нам нужно найти хороший баланс между смещением и дисперсией, чтобы минимизировать общую ошибку.


Оптимальный баланс смещения и дисперсии никогда не будет соответствовать или не соответствовать модели.
Поэтому понимание предвзятости и дисперсии имеет решающее значение для понимания поведения моделей прогнозирования.
Random Forests and the Bias-Variance Tradeoff

Oct 10, 2018 · 9 min read
The Random Forest is an extremely popular machine learning algorithm. Often, with not too much pre-processing, one can throw together a quick and dirty model with no hyperparameter tuning and acheive results that aren’t awful. As an example, I put together a RandomForestRegressor in Python using scikit-learn for the New York City Taxi Fare Prediction playground competition on Kaggle recently, passing in no arguments to the model constructor and using 1/100 for the training data (554238 of
55M rows), for a validation R² of
0.8. Try it yourself!
NOTE: This s n ippet assumes you split the data into training and validation sets with your features and target variable separated. You can see the full code on my GitHub profile.
Part of what makes this algorithm so clever is how it handles something called the bias-variance tradeoff. I explore this aspect of Random Forests in the following 5 steps:
Bias and Variance
The Mean Squared Error (MSE) of a statistical model can be expressed as the sum of the squared bias of its predictions, the variance of those predictions, and the variance of some error term 𝜖. Since both squared bias and variance are non-negative, and 𝜖, which captures randomness in the data, is beyond our control, we minimize MSE by minimizing the variance and bias of our model. I have found the image in Fig. 1 to be particularly good at illustrating what the two terms mean.

We say our model is biased if it systematically under or over predicts the target variable. In machine learning, this is often the result either of the statistical assumptions made by our model of choice or of bias in the training data. Take a look at this article for an example of bias where Google’s Cloud Natural Language API learned through text on the internet that the word “homosexual” carries an inherent negative connotation.
Variance, on the other hand, in some sense captures the generalizability of the model. Put more precisely, it is a measure of how much our prediction would change if we trained it on different data. High variance typicaly means that we are overfitting to our training data, finding patterns and complexity that are a product of randomness as opposed to some real trend. Generally, a more complex or flexible model will tend to have high variance due to overfitting but lower bias because, averaged over several predictions, our model more accurately predicts the target variable. On the other hand, an underfit or oversimplified model, while having lower variance, will likely be more biased since it lacks the tools to fully capture trends in the data.
What we would like, ideally, is low bias-low variance. To see how to acheive this, let’s first look at a typical bias squared-variance curve.

Fig. 2 illustrates the general trend I described above of decreasing bias and increasing variance as our model gets more complex. Our goal is to choose a model that minimizes the sum of the two as illustrated by the dotted line. To see how a Random Forest does this particularly well, let’s start with a simple decision tree.
Decision Trees
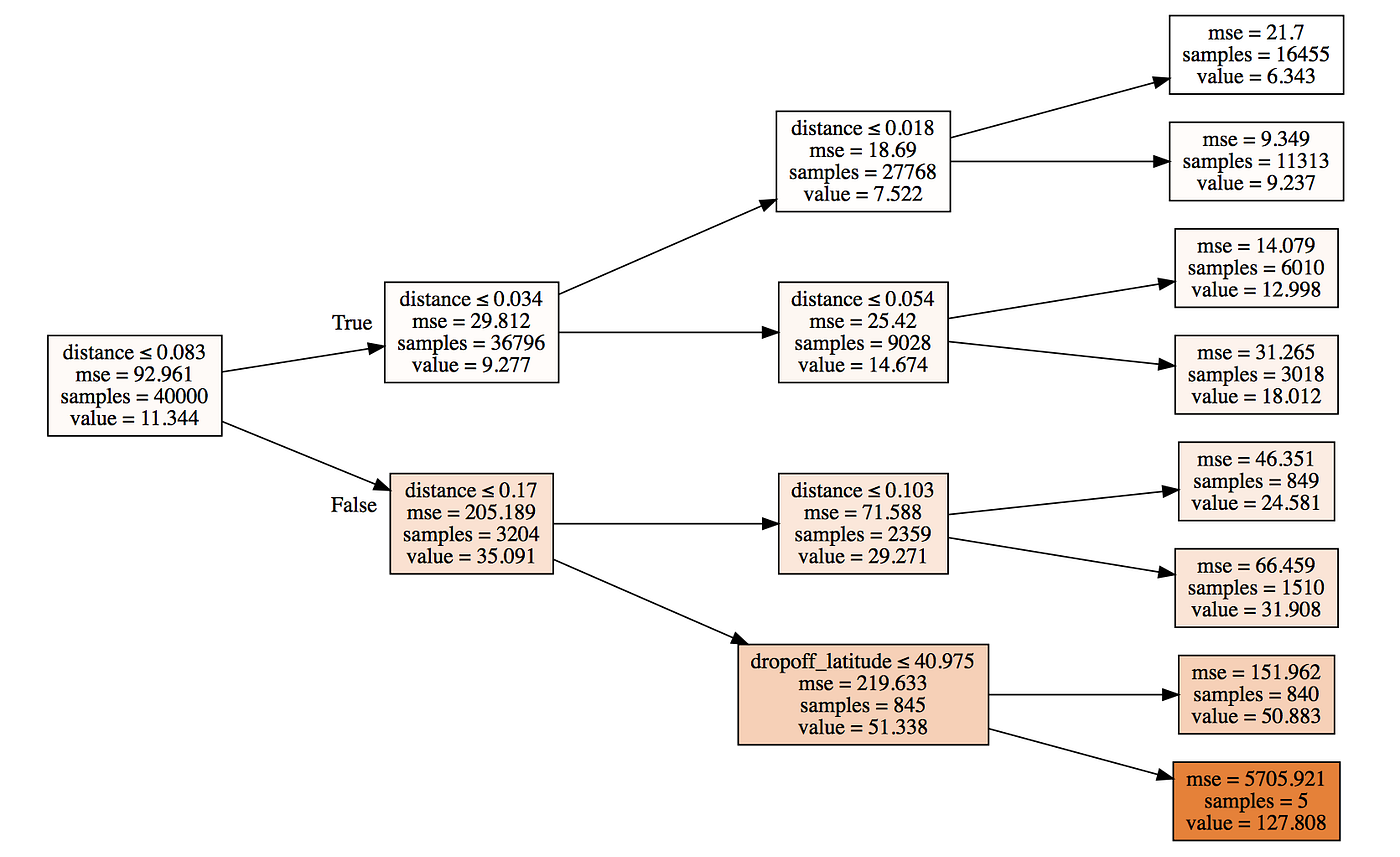
Let’s go back to the taxi fare prediction task. Given certain features of a particular taxi ride, a decision tree starts off by simply predicting the average taxi fare in the training dataset ($11.33) as shown in the leftmost box in Fig. 3. It then goes through the list of all features and their values to find a binary split that gives us the maximum improvement in MSE. This is typically calculated by predicting the mean of each of the two new subsets and computing their respective MSEs weighted by the number of observations in each.
As illustrated by the figure, it then splits each branch into new branches on the same criterion of maximal improvement in MSE, continuing recursively until each leaf (group of samples) has only one training observation in it. Decision Trees have extremely low bias because they maximally overfit to the training data. Each “prediction” it makes on the validation set would in essence be the fare of some taxi ride in our training data that ended up in the same final leaf node as the ride whose fare we are predicting. This overfitting, however, also results in unacceptably high variance and consequently poor predictions on unseen data.
Bagging, Bootstrapping, and Random Forests
While an individual tree is overfit to the training data and is likely to have large error, bagging ( Bootstrap Aggregat ing) uses the insight that a suitably large number of uncorrelated errors average out to zero to solve this problem. Bagging chooses multiple random samples of observations from the training data, with replacement, constructing a tree from each one. Since each tree learns from different data, they are fairly uncorrelated from one another. Plotting the R² of our model as we increase the number of “bagged” trees ( scikit-learn calls these trees estimators ) illustrates the power of this technique.

Think of each tree in our forest as learning some unique insights about what contributes to the fare of a New York City taxi from the subset of data it models. Averaging together each of their predictions then gives us a stronger, more stable model able to predict the fare of a taxi ride it hasn’t previously been exposed to with better accuracy.
Hyperparameter Tuning
Random Forests, however, are more than just bagged trees and use a number of interesting techniques to further decrease correlation between trees and reduce overfitting. A quick look at the documentation for scikit-learn’s implementation of the RandomForestRegressor shows us the hyperparameters we can pass in:
n_estimators
n_estimators is simply the number of trees. The more uncorrelated trees in our forest, the closer their individual errors get to averaging out. However, more is not always better and here are some considerations to keep in mind:
max_depth
max_depth is a hyperparameter that I typically leave untouched simply because what I really care about is how many observations are at the end of a branch before I forbid the tree from splitting further. This is a better predictor of how overfit the Random Forest is.
min_samples_leaf
If this is a leaf node, which would be the case if min_samples_leaf = 1 (the default), the forest is predicting the actual fare of the particular ride in the training set to which this ride happened to be closest. It is almost a certainty that splits toward the ends of the branches aren’t capturing actual patterns about the fare of taxi rides in New York City, but just what happened to correspond to a higher or lower fare in the training data. Passing in some larger min_samples_leaf means that we now predict the average of some group of samples to which the ride in question is closest in tree space. This technique generalizes noticeably better.
max_features
A practical example
It randomly tries n_iter combinations of these parameters and returns the best hyperparameters of those sampled and the corresponding score. To illustrate the effect of changing individual parameters, however, I show here how my RandomForestRegressor performed for some manually chosen combinations. First let’s see how well a Random Forest with n_estimators = 100 with no other arguments passed in performs:
0.824. Here’s what playing with max_features does:
While using max_features = ‘log2’ times the number of features improved performance somewhat, max_features = ‘sqrt’ did the opposite. What works best is likely to vary from case to case, making some form of trial and error the simplest and most popular option. Feel free to play around with some other hyperparameters by yourself. For the sake of brevity, I won’t do that here. Finally, after choosing my hyperparameters, I trained one RandomForestRegressor using a larger number of estimators to further improve R²:
Conclusion
To sum up, the Random Forest employs a number of techniques to reduce variance in predictions while maintaining (to some extent) the low variance that was characteristic of the lone Decision Tree. It does this primarily by averaging together a number of very weakly correlated (if not completely uncorrelated) trees. Hyperparameters like max_features and min_samples_leaf are among the techniques useful in reducing this correlation between trees, but they often come at the cost of some increase in bias, since each tree now has less data to work with.
Our goal, then, is to choose a set of hyperparameters that nagivates this tradeoff between bias and variance so as to minimize error (or maximize goodness-of-fit) on some new set of data (the validation set) that we believe is representative of what the model might encounter when solving the real world problem it was designed for (the test set).